MemScope
Local-first firmware footprint intelligence for embedded teams.
MemScope analyzes your ELF, MAP, and linker artifacts to give you a clear picture of where your firmware’s flash and RAM are going — and gates your CI build when a regression sneaks in. Built for embedded engineers who want SonarQube-style enforcement without sending build artifacts to a cloud.
pip install memscope-fw
Screenshots
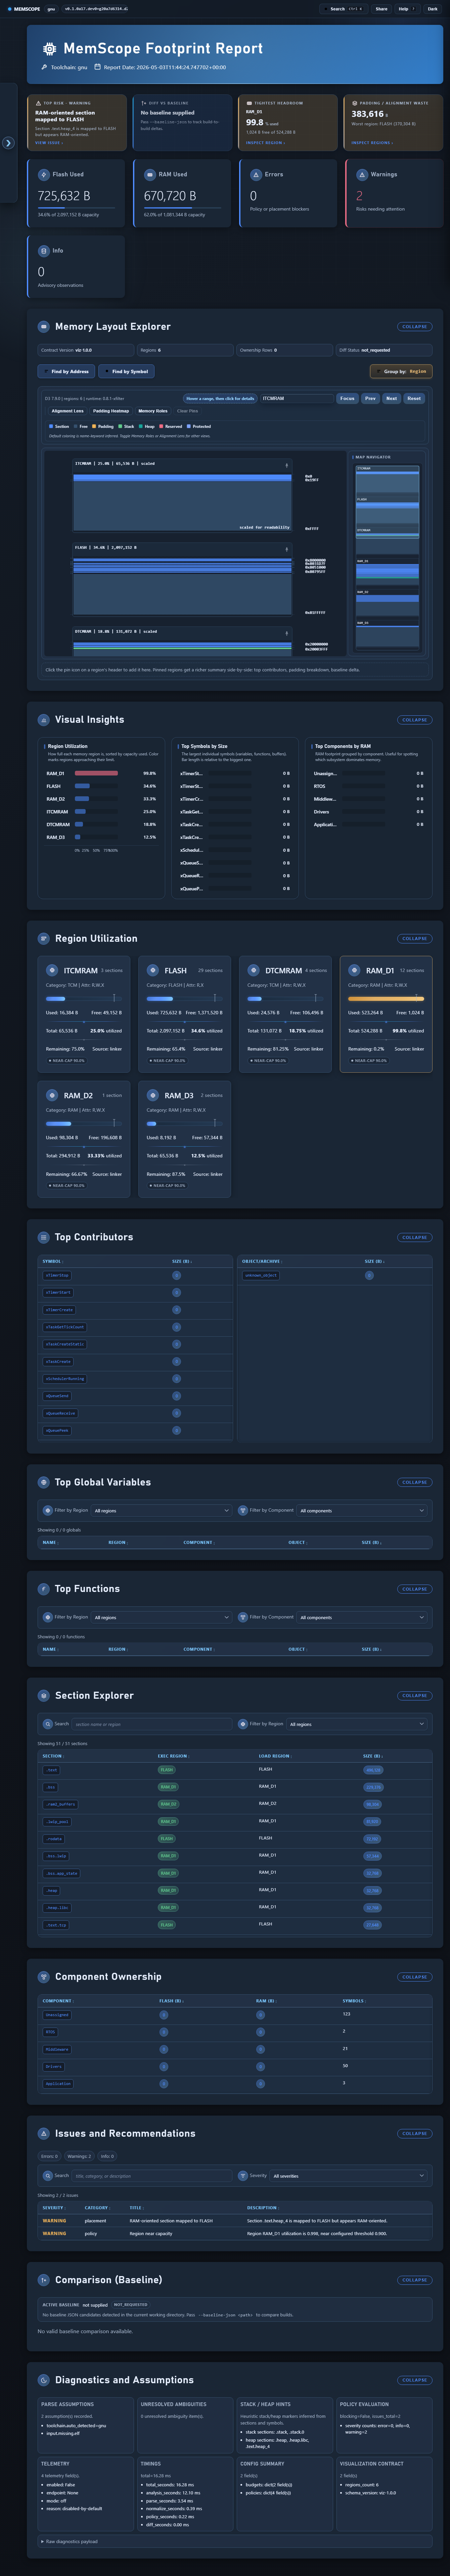
A single memscope analyze run on a representative STM32H7-class firmware (Cortex-M7 + FreeRTOS + lwIP + USB CDC, 6 memory regions, ~100 contributing input sections, ~150 symbols) produces this self-contained interactive HTML report — open it in any browser, no internet required, no JS framework to install. Headline cards surface the tightest region (here, RAM_D1 at 99.8% capacity — the kind of near-overflow that’s invisible until you flash silicon), total Flash / RAM consumption, and the alignment-waste budget you could reclaim:
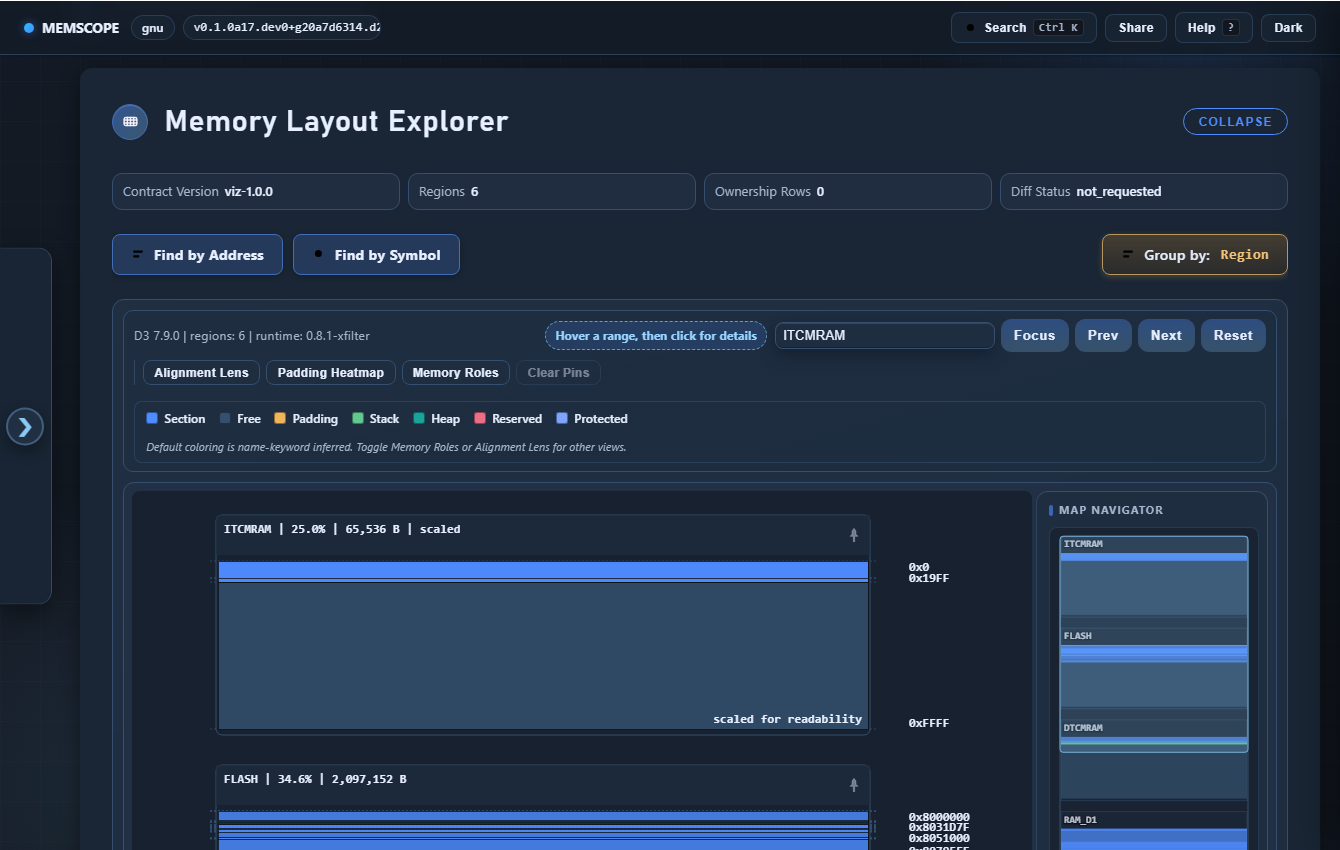
Below the fold: Memory Layout Explorer (interactive section bars per region), Visual Insights (top contributors / functions / globals), Region Utilization (per-region capacity, alignment overhead, fragmentation), Section Explorer (drill-down with byte-level lookup), Component Ownership, Issues and Recommendations, Comparison vs baseline, and Diagnostics and Assumptions so reviewers can see exactly what was inferred vs measured. See the full-page screenshot →
memscope diff compares two builds and highlights the regressions that matter — headline byte deltas, per-region growth chart, top regressions and reductions tables, plus a deterministic JSON contract your CI can gate on:
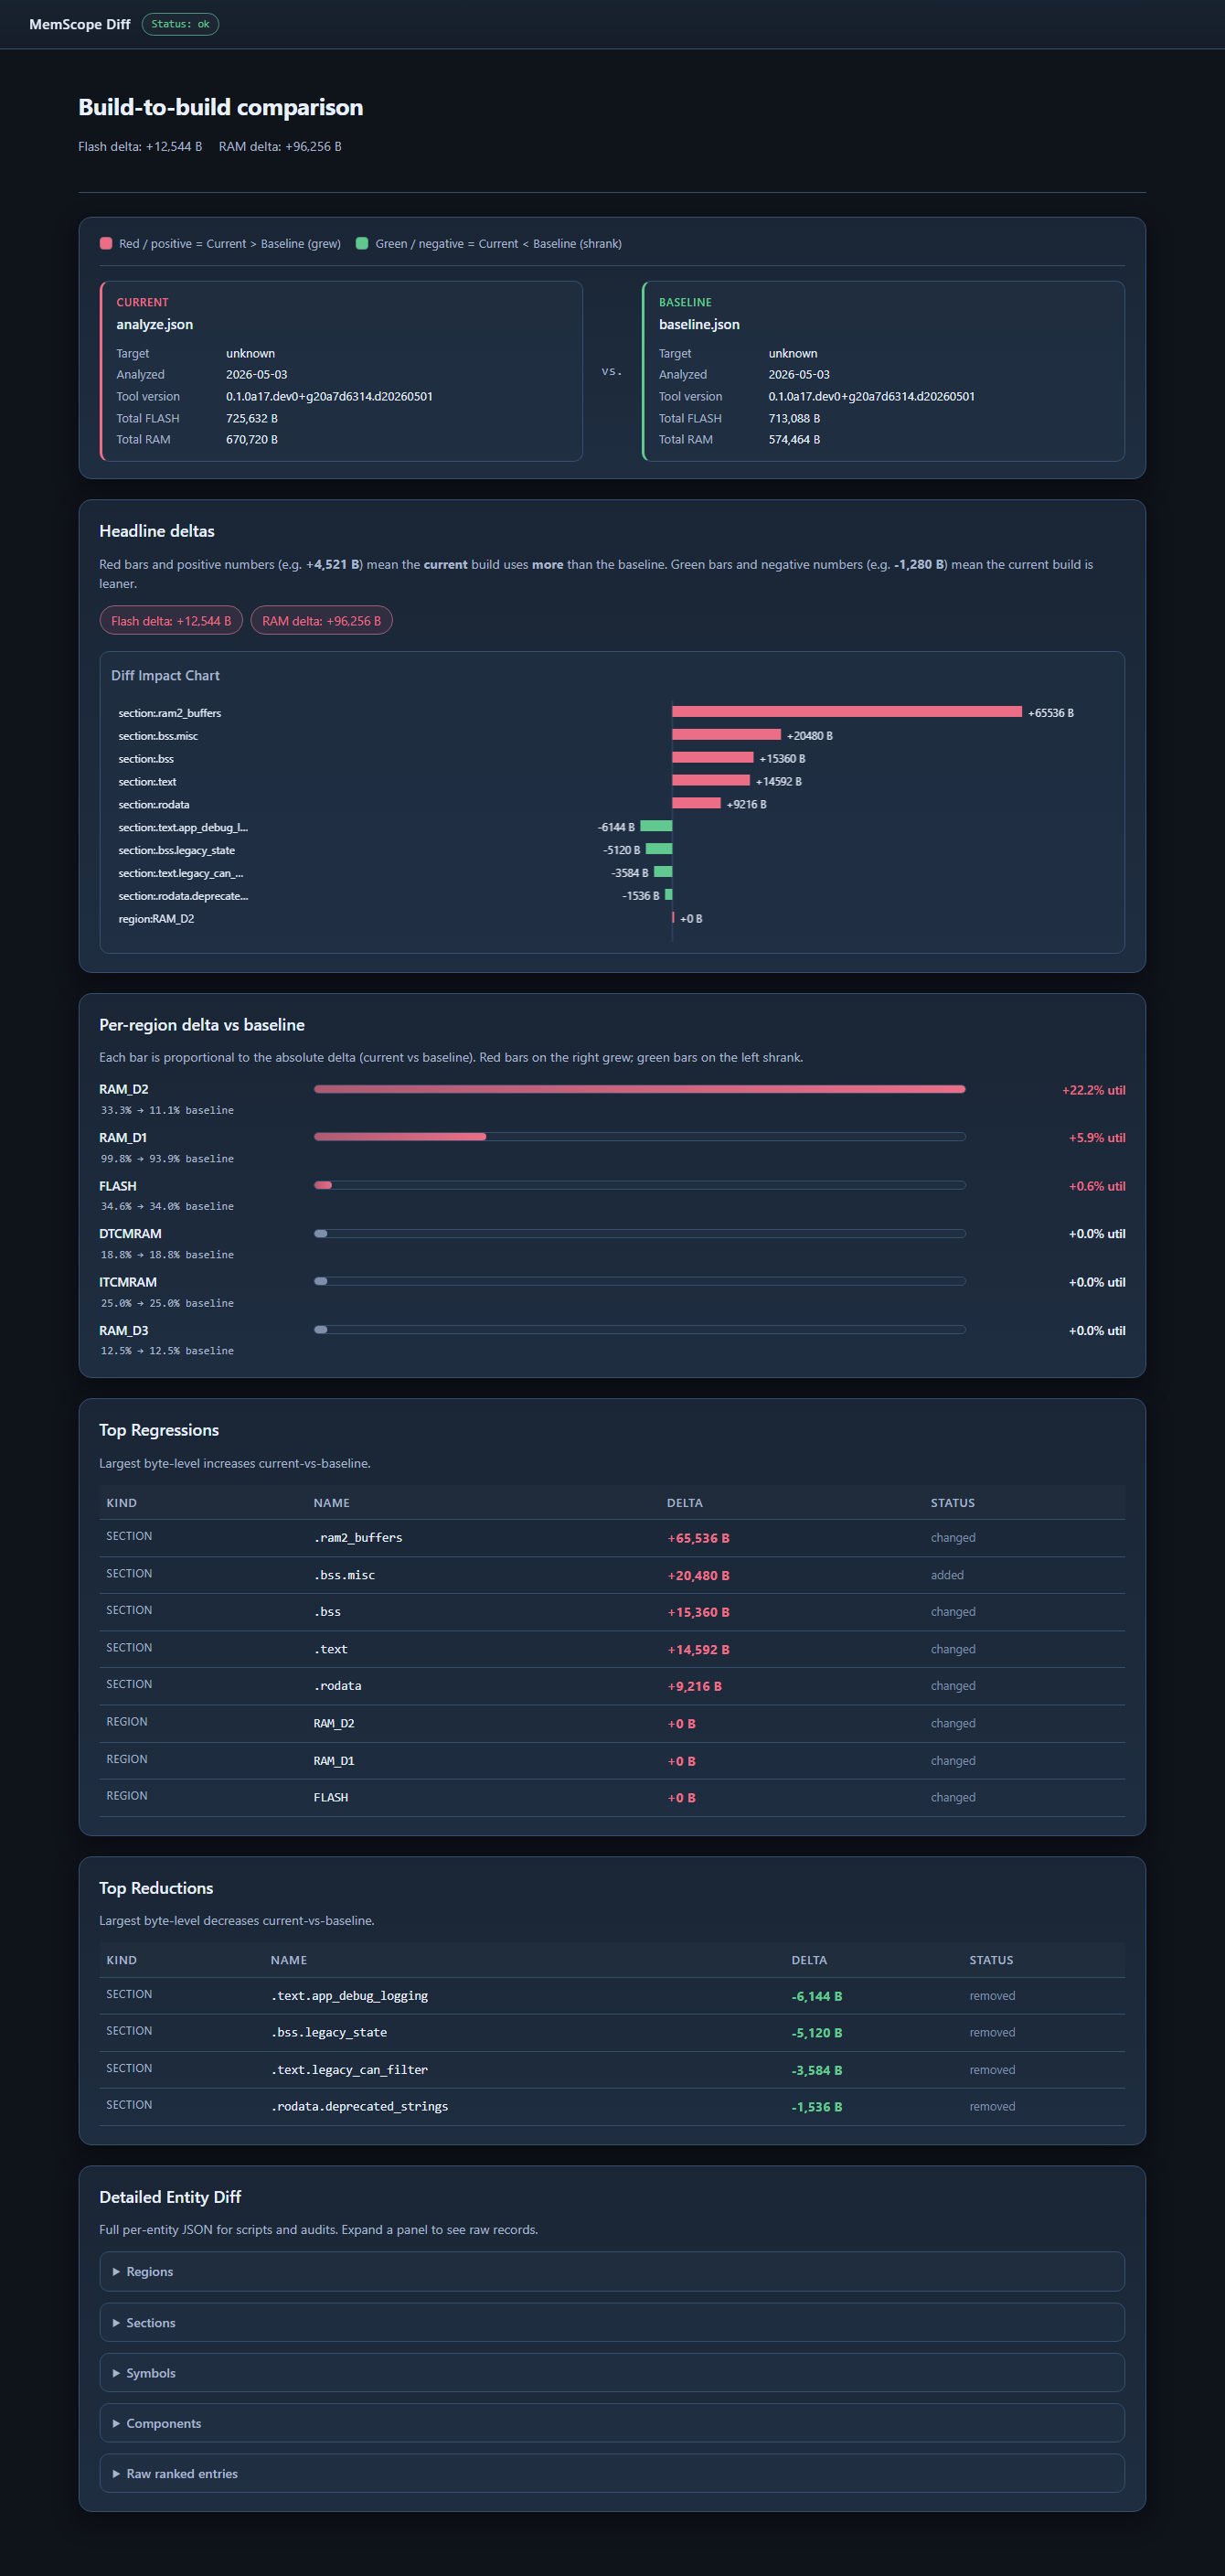
The fixtures used to generate these screenshots are in docs/demo/ — reproducible with python -m memscope analyze --map docs/demo/demo.map --linker docs/demo/demo.ld --html report.html.
License at a glance. MemScope is free — the
memscope-fwdistribution on PyPI is gratis for any use, including commercial use by companies of any size. No license key, no watermark, no time limit, no seat count, no procurement required. Runanalyze,validate,diff, and--strictCI gating today, indefinitely. Optional commercial Bundles (PR/Slack notifications, SoC-family analysis extras, ISO 26262 / IEC 62304 / DO-178C compliance evidence packages, custom bespoke extensions) extend the tool for paying customers — those are delivered as Customer-Bound Wheels separately from the free PyPI core. Bundle licences are not yet for sale — the commercial entity is still being registered. Closed-source proprietary EULA — not OSI / FSF open source. Full text: see the License section on this PyPI page (or theLICENSEfile shipped inside the installed wheel).
What it does
- Inspects ELF + MAP + linker scripts and reconstructs the per-region, per-section, per-symbol, per-component memory layout — everything that’s actually placed in your firmware image and what each part costs.
- Reports in three forms from a single run: a compact terminal summary for CI logs, a versioned JSON for scripts and dashboards, and a self-contained interactive HTML for engineers to explore.
- Gates CI builds when a budget is busted, a region overflows, or a baseline diff exceeds your threshold — fail-fast with deterministic exit codes.
- Compares two builds side-by-side via
memscope diff, showing top regressions and reductions across regions, sections, symbols, and components. - Runs entirely offline. The free core makes no network calls. No build artifacts ever leave your machine. No cloud backend.
Why teams pick MemScope over rolling their own scripts
| Capability | Hand-rolled scripts | MemScope |
|---|---|---|
| Parse ELF + MAP + linker config consistently across toolchains | Different per project | One CLI, GNU + IAR + Keil + Clang/LLD all supported (dedicated parsers per toolchain, normalized to a single internal model) |
| Stable JSON schema your CI can rely on | Brittle | Versioned + validate subcommand |
| Drop-in CMake integration | DIY | cmake/FirmwareFootprint.cmake |
| Interactive HTML report for design reviews | None | Self-contained, no internet needed to open |
| CI gating with friendly error messages | grep + bash | --strict exit codes |
| Multi-core / multi-region partition awareness | Usually missing | First-class |
Install
pip install memscope-fw
Requires Python ≥ 3.11. Wheels are published per-platform for Windows (x86_64) + Linux (manylinux2014, x86_64) + macOS (Apple Silicon / arm64), each on Python 3.11 / 3.12 / 3.13 / 3.14.
5-minute quick start
# 1. Analyze a single build — produces report.html you can open in any browser
memscope analyze \
  --elf path/to/firmware.elf \
  --map path/to/firmware.map \
  --linker path/to/linker.ld \
  --json report.json \
  --html report.html

# 2. Compare two builds (e.g. before/after a refactor)
memscope diff \
  --current-json report.json \
  --baseline-json baseline.json \
  --html diff.html

# 3. Gate CI on a regression budget (exits non-zero if violated)
memscope analyze --strict \
  --elf firmware.elf --map firmware.map --linker linker.ld \
  --baseline-json baseline.json
The HTML report is fully self-contained — D3, ECharts, and all interactive visualizations are bundled inline, so it works in air-gapped CI environments and can be archived as a single file.
What’s free vs what’s paid
Free for everyone, forever (the memscope-fw distribution on PyPI):
analyze— full ELF/MAP/linker analysis, all reportsvalidate— JSON-schema sanity check, ideal as a CI-pipeline wedgediff— baseline comparison + interactive visualization--strictexit codes for CI gating- Custom
[budgets]/[policies]/[suppressions]config sections - CSV export
- Plain-text + markdown memory-layout dumps (
--text/--markdown) — full-memory hierarchical region → section → top-symbols trees, designed for PR comments, build logs, anddiff-friendly snapshots - HTML report with full Memory Layout Explorer
- All current and future toolchain parsers (GNU, Keil, Clang/LLD, etc.)
Paid commercial Bundles (delivered as Customer-Bound Wheels, separately from PyPI):
- PR / Slack / email notifications — auto-post footprint diffs as comments on GitHub / GitLab / Bitbucket pull requests. Subscription Bundle.
- SoC-family analysis extras — STM32 dual-core partition awareness, NXP S32K safety regions, Nordic SoftDevice handling, ESP32 IRAM/DRAM/PSRAM separation, etc. Subscription Bundle.
- Compliance evidence Bundles — ISO 26262 TCL evidence, IEC 62304 SOUP qualification, DO-178C tool qualification kit. One-Time fee + optional annual maintenance.
- Custom toolchain support — IAR, Renesas RX/RH850, Microchip MPLAB, custom proprietary linker formats. One-Time engineering contract.
- Bespoke per-customer features — internal symbol-renaming preprocessor support, custom HTML branding, internal-format adapters. One-Time engineering contract.
Bundle availability. Bundle licences are not yet on sale. The commercial entity that will issue them is being registered; until then, only the free core is operational and there is nothing to purchase. To be notified when Bundles become available, email dumitrescu.adrian121@gmail.com.
Documentation
Public documentation (CLI reference, CMake integration, CI tutorial, report interpretation guide, config schema, troubleshooting, privacy & GDPR posture, enterprise procurement Q&A) ships in docs/public/ and is also published at https://adrian-dumitrescu.github.io/memscope-docs/.
A condensed walkthrough is available via:
memscope --help                         # top-level commands
memscope analyze --help                 # per-command reference
Every subcommand has built-in --help documentation.
Privacy posture
- The free core makes no network calls of any kind. Your ELF / MAP files never leave your machine.
- Optional Subscription Bundles (when purchased) contact the licensing backend (Keygen.sh) on first activation and on a periodic refresh interval, transmitting only the License Key, a machine fingerprint hash, and the Bundle version. No analysis content is ever transmitted.
- Opt-in telemetry is OFF by default; if enabled in
memscope.toml, the User specifies the recipient endpoint — the Licensor neither receives nor stores telemetry. - Full privacy policy:
docs/public/privacy.md.
Support
For Bundle inquiries, custom engineering engagements, bug reports in the free core, and integration help:
When reporting an issue, please include the output of memscope diagnostics export — it bundles version, environment, and parser diagnostics into a single ZIP that’s safe to attach.
License
Closed-source proprietary EULA. The binding text — with a Plain-English summary at the top — is in the LICENSE file shipped inside the wheel, and surfaced in the License section on the PyPI project page.
In short:
- Free core (the PyPI distribution) is gratis for any use, including commercial use inside a company. No license key, no seat count, no time limit, no payment, no contact with the maintainer required.
- Optional commercial Bundles are delivered as Customer-Bound Wheels separately from PyPI, under either Subscription, One-Time, or Bespoke licensing models. Not yet generally available for sale — register interest at dumitrescu.adrian121@gmail.com.
- Not open source. No rights are granted under any OSI-approved or FSF-recognised license. Source code is not distributed; you receive the binary wheel published on PyPI.